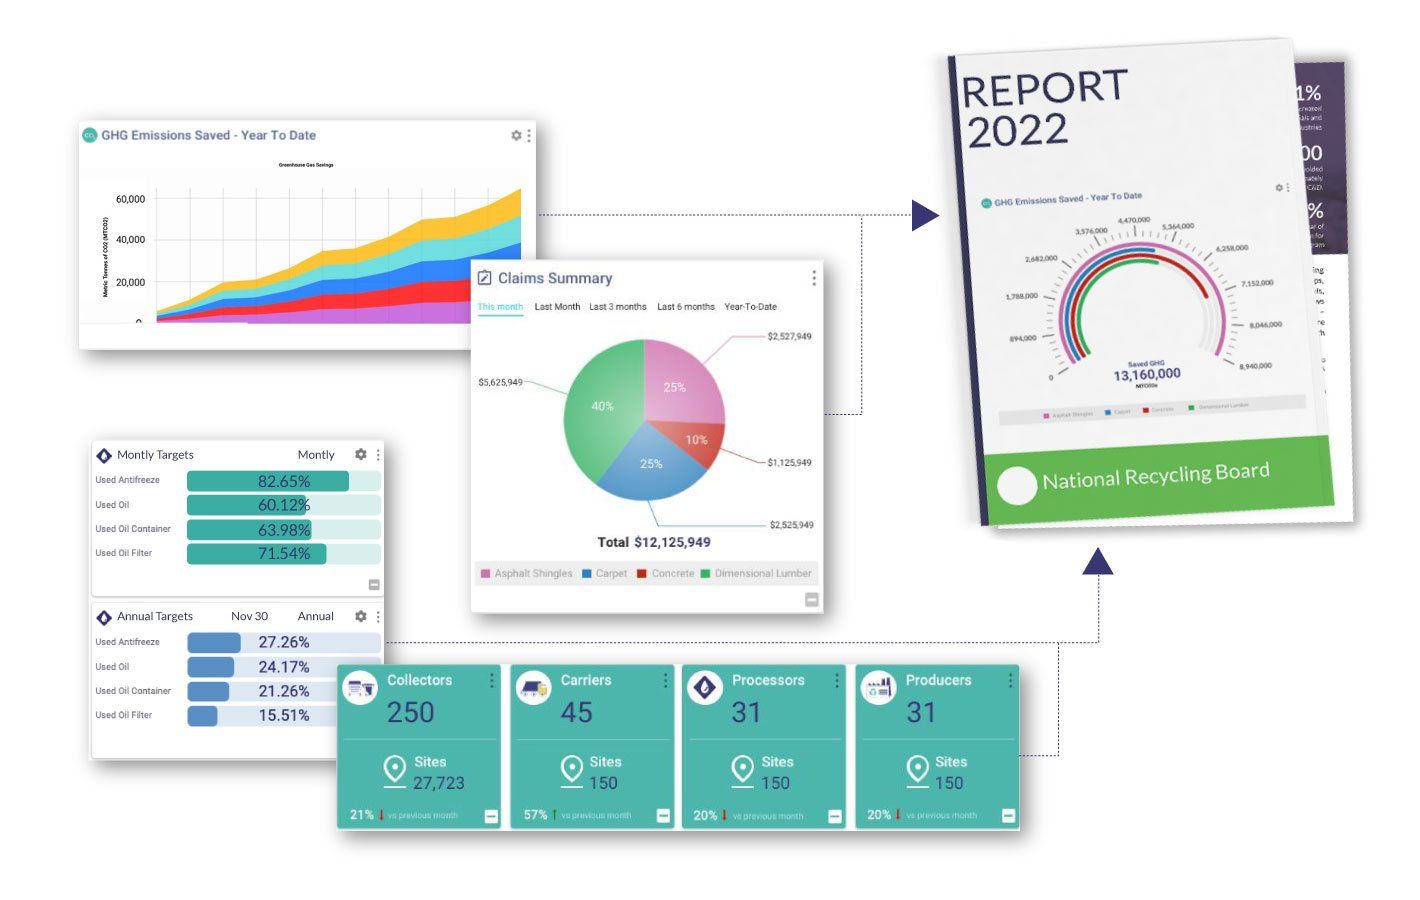
Easily view and analyze anything from users and transactions to volume or weight of collected materials and greenhouse gas (GHG) emission reduction in real time. Get an instant and accurate picture of how you’re progressing towards your goals, and monitor your performance to take appropriate business decisions.
Configure Tailored Dashboards
Create a dashboard with widgets specific to your business, goals and/or reporting requirements. Easily add or change widgets to match your growing needs and have all the information you need to in one place, with easy-to-interpret dashboards, charts and reports.
Full visibility lets you trace issues and errors that are skewing your data – so you can correct them right at the source. Using this type of visibility, you can get a historical or real-time image of every single thing happening in your program, both from a high-level performance view and a detailed view.
Explore some of our client's favourite widgets
Set monthly and annual targets for each one of your waste streams or products.
See in real-time where you stand against your targets and correct your operations accordingly to reach your goals. Don’t wait for weeks – or months – to find how your program is performing.
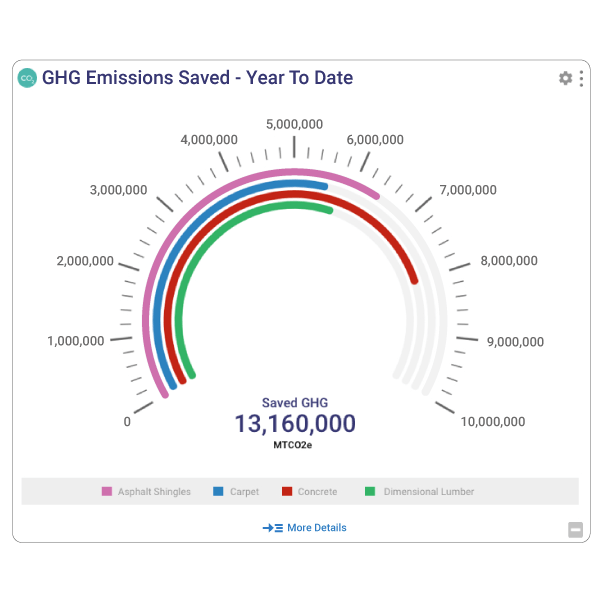
What is the GHG impact of your landfill diversion? Stop the guessing games!
Use current, not outdated, data to track your greenhouse gas emission reduction and generate accurate report for your ESG initiatives.
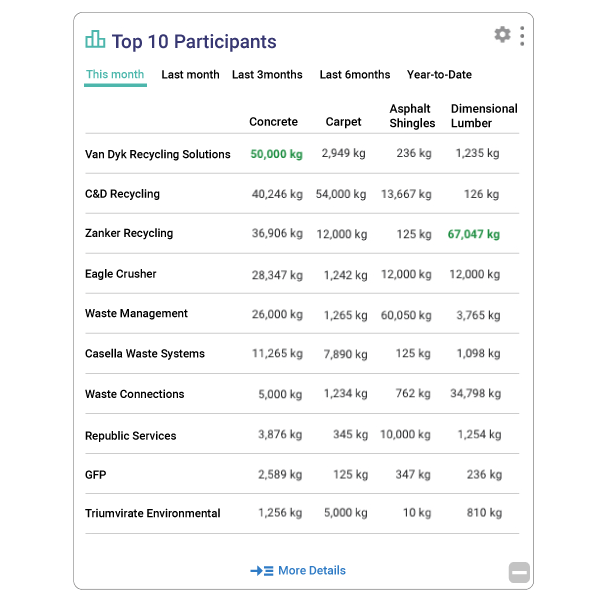
Quickly visualize the performance of participants in your program. Assess the quality of their contributions and make business decisions based on facts and real data.
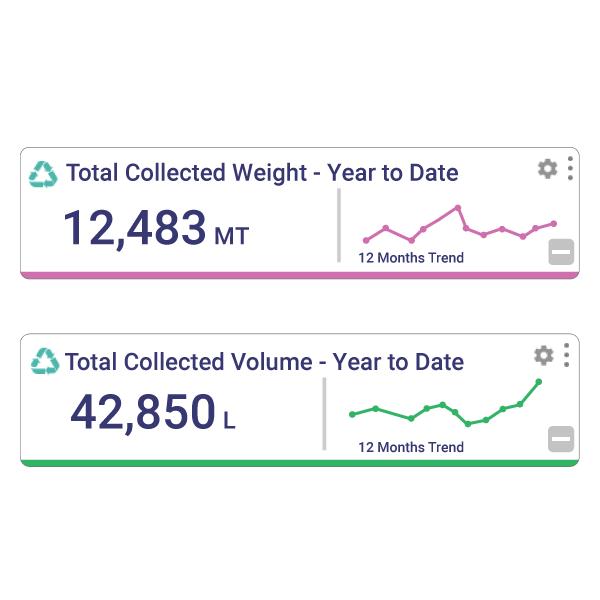
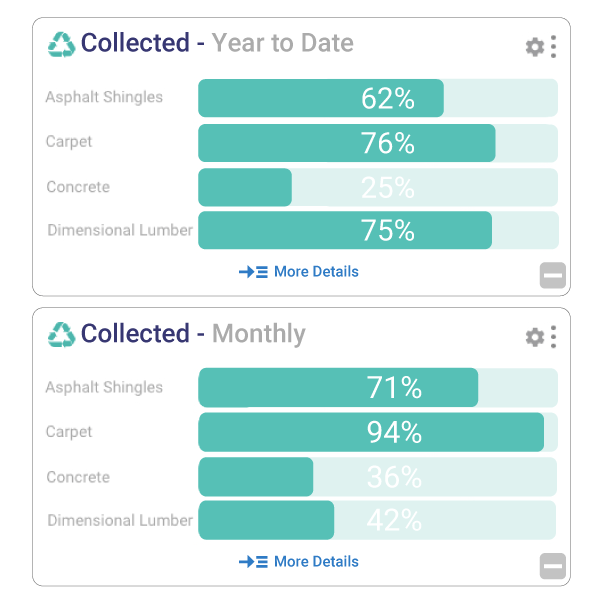
Know at-a-glance the total weight and/or volume your program has collected to-date. Keep track of your performance and trends to make accurate business decisions.
LIVE DATA VISUALIZATION THAT LEADS TO REAL-TIME REPORTS.
Report on anything from inventory, transactions, volume of waste collected & diverted from landfill or greenhouse (GHG) emission reduction--all with just a few clicks of your mouse. You can create reports using current (not outdated) data to track, measure and showcase your progress.